Profiling
Introduction
What is Pyroscope?
Pyroscope is an open-source continuous profiling platform designed to provide developers with insights into their application's performance. It helps identify performance bottlenecks and optimize code by understanding how resources are utilized.
How Does It Work?
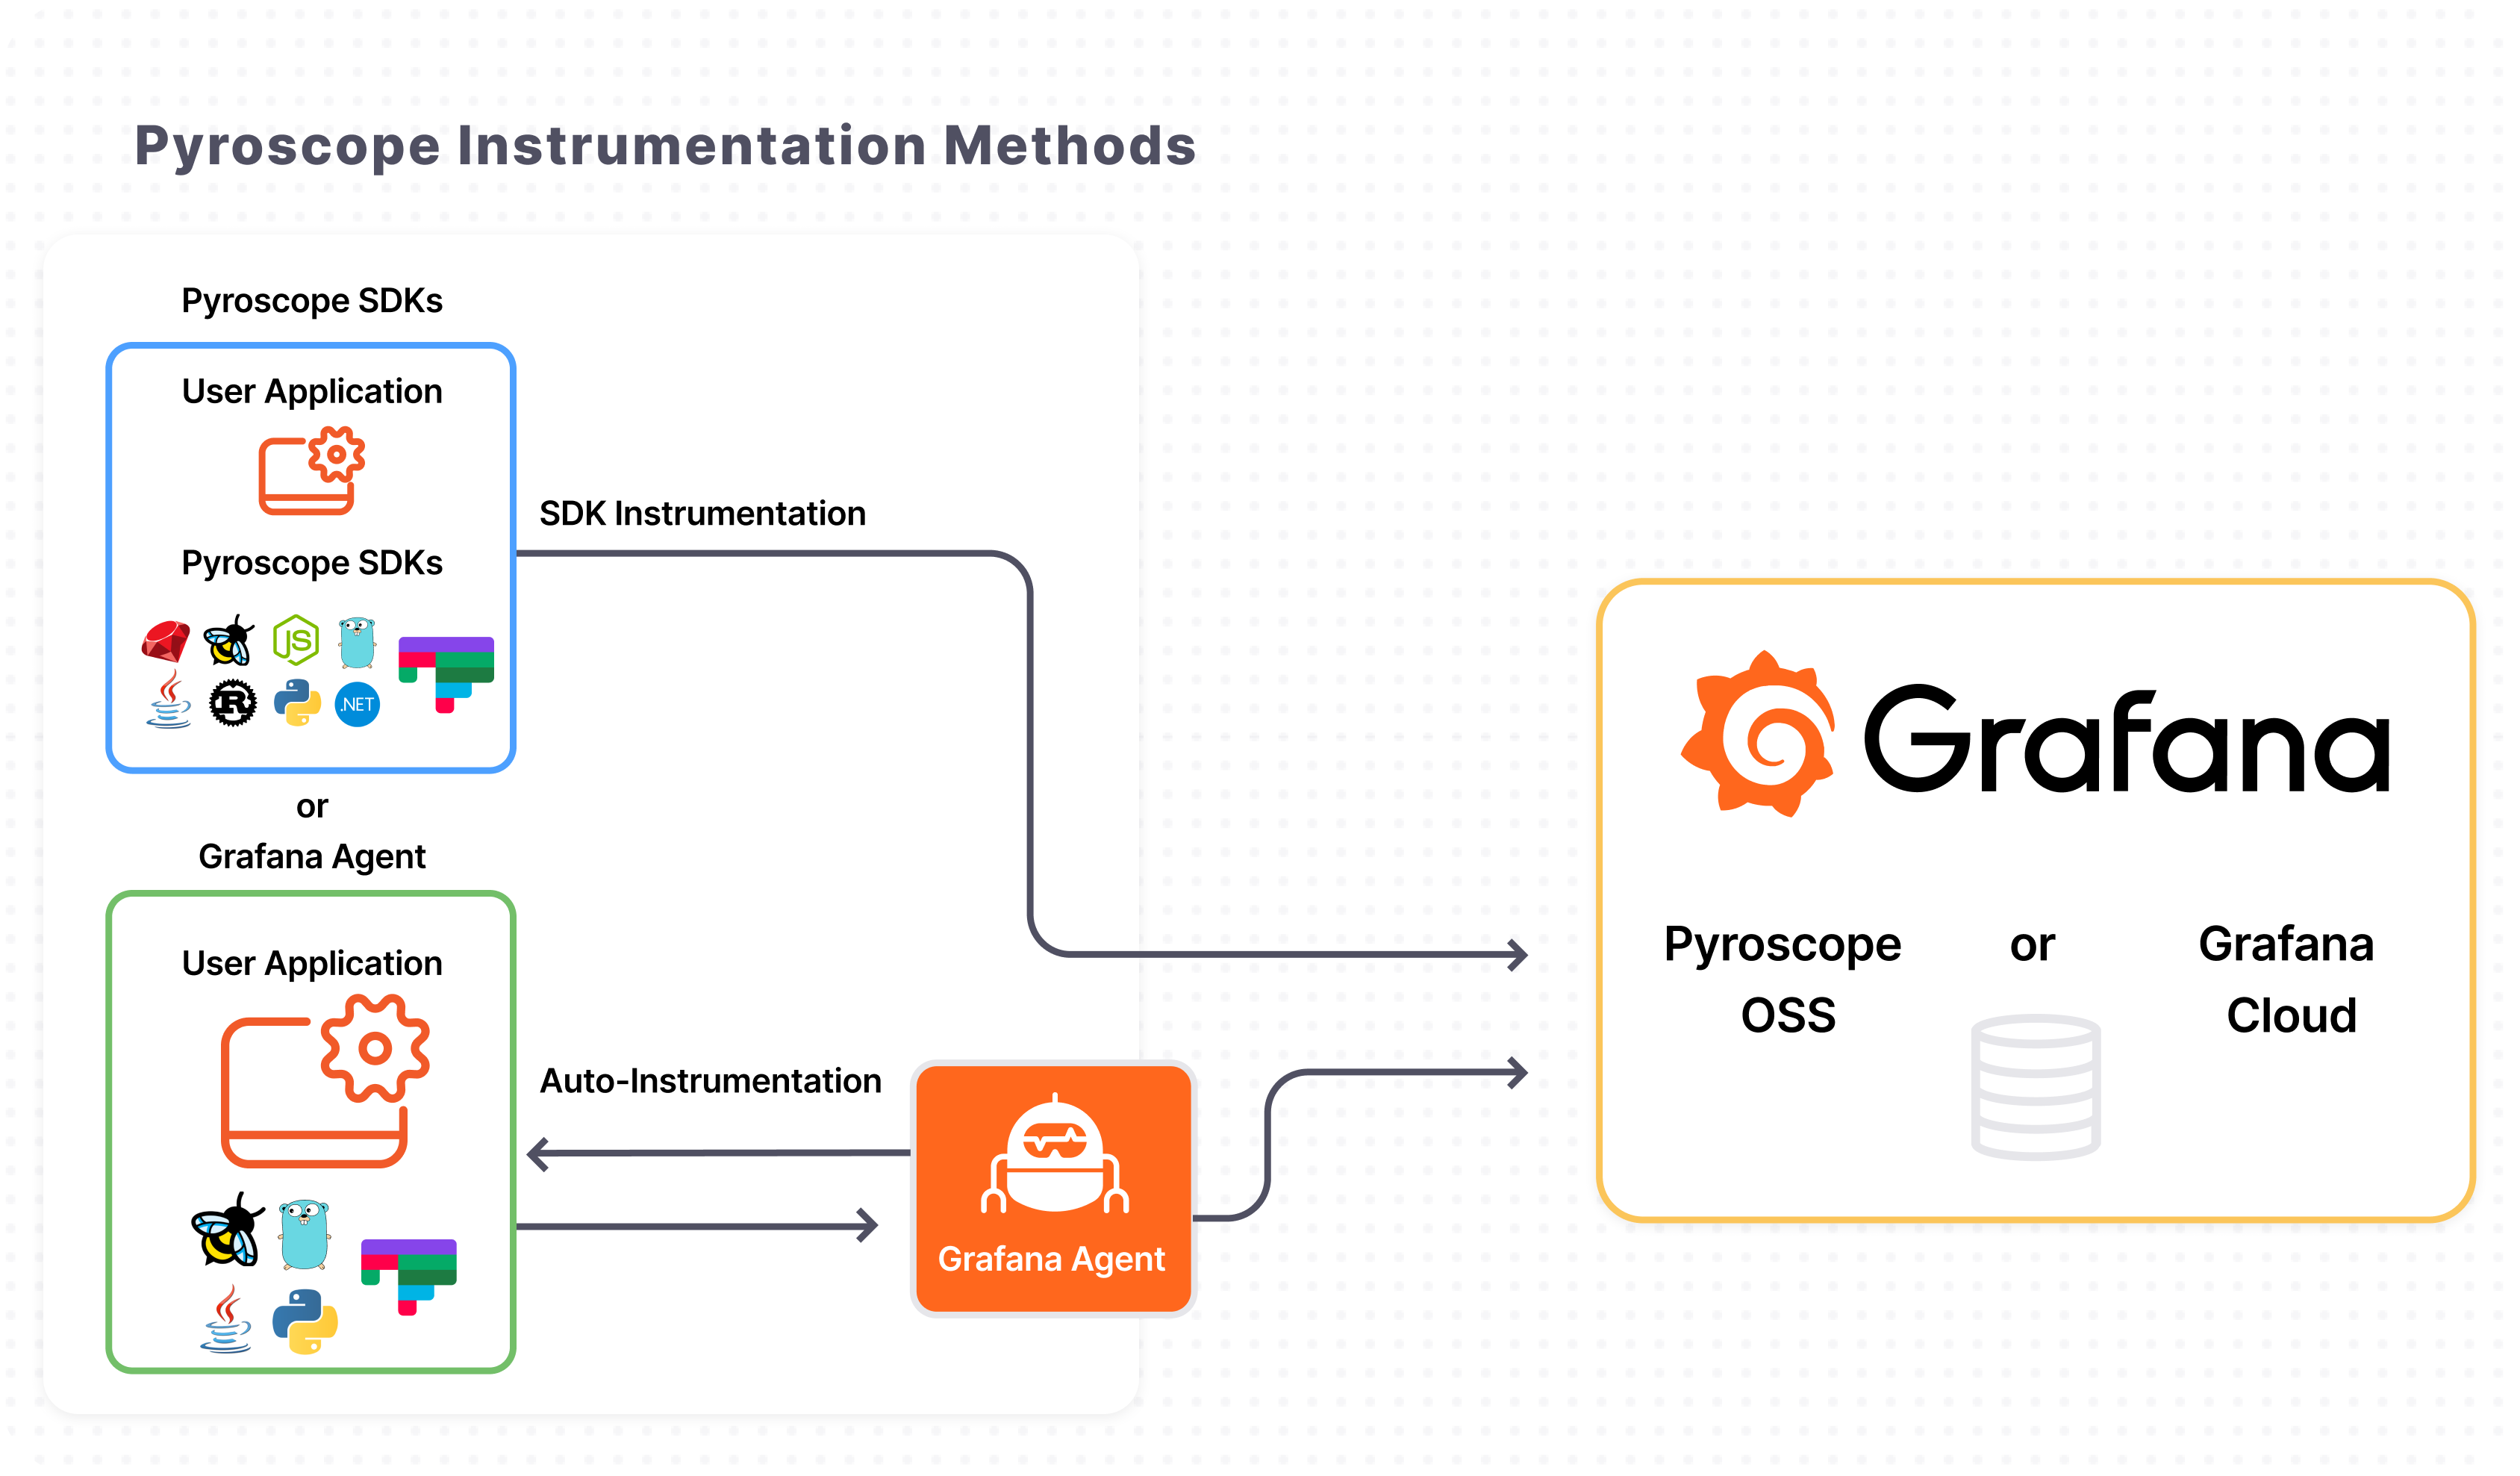
Pyroscope continuously collects profiling data from applications using a technique called sampling. This involves taking snapshots of the call stack every few milliseconds, creating a detailed picture of the application's time utilization. The profiling data can be collected via SDK instrumentation or auto-instrumentation using the Grafana Agent, with the latter being a simpler option for our use case.
Note: The SDK offers more control over the profiling process. For additional information, refer to this page.
What is Grafana Agent?
Grafana Agent is a lightweight telemetry collector designed for sending metrics, logs, and trace data to Grafana Cloud. It serves as a more integration-focused and memory-efficient version of Prometheus. When used with Pyroscope, Grafana Agent collects profiling data, which can then be visualized alongside other metrics and logs in Grafana.
NB: Grafana Agent will reach an End-of-Life (EOL) on November 1, 2025.
Interaction Between Pyroscope and Grafana Agent
The interaction involves the Grafana Agent collecting profiling data from applications and sending it to the Pyroscope server. This process includes:
- Deployment: The Grafana Agent is deployed on servers with Pyroscope integration enabled in the configuration.
- Data Collection: Profiling data is collected by sampling the call stack every few milliseconds.
- Data Transmission: The data is sent to the Pyroscope server's
/ingestendpoint via a POST request. - Data Storage: The Pyroscope server stores the profiling data for analysis.
- Data Analysis: Users can analyze the data using the Pyroscope UI, providing insights into application performance, identifying patterns, and finding optimization opportunities.
Flame Graphs
Flame graphs are used to visualize the execution path of a request, unifying its distinct service calls into a single distributed trace. Each span, represented as a bar, shows an individual unit of work, such as an API call or database query. The x-axis measures the duration, while the y-axis shows the depth of the call stack. This visualization helps quickly identify bottlenecks within applications.
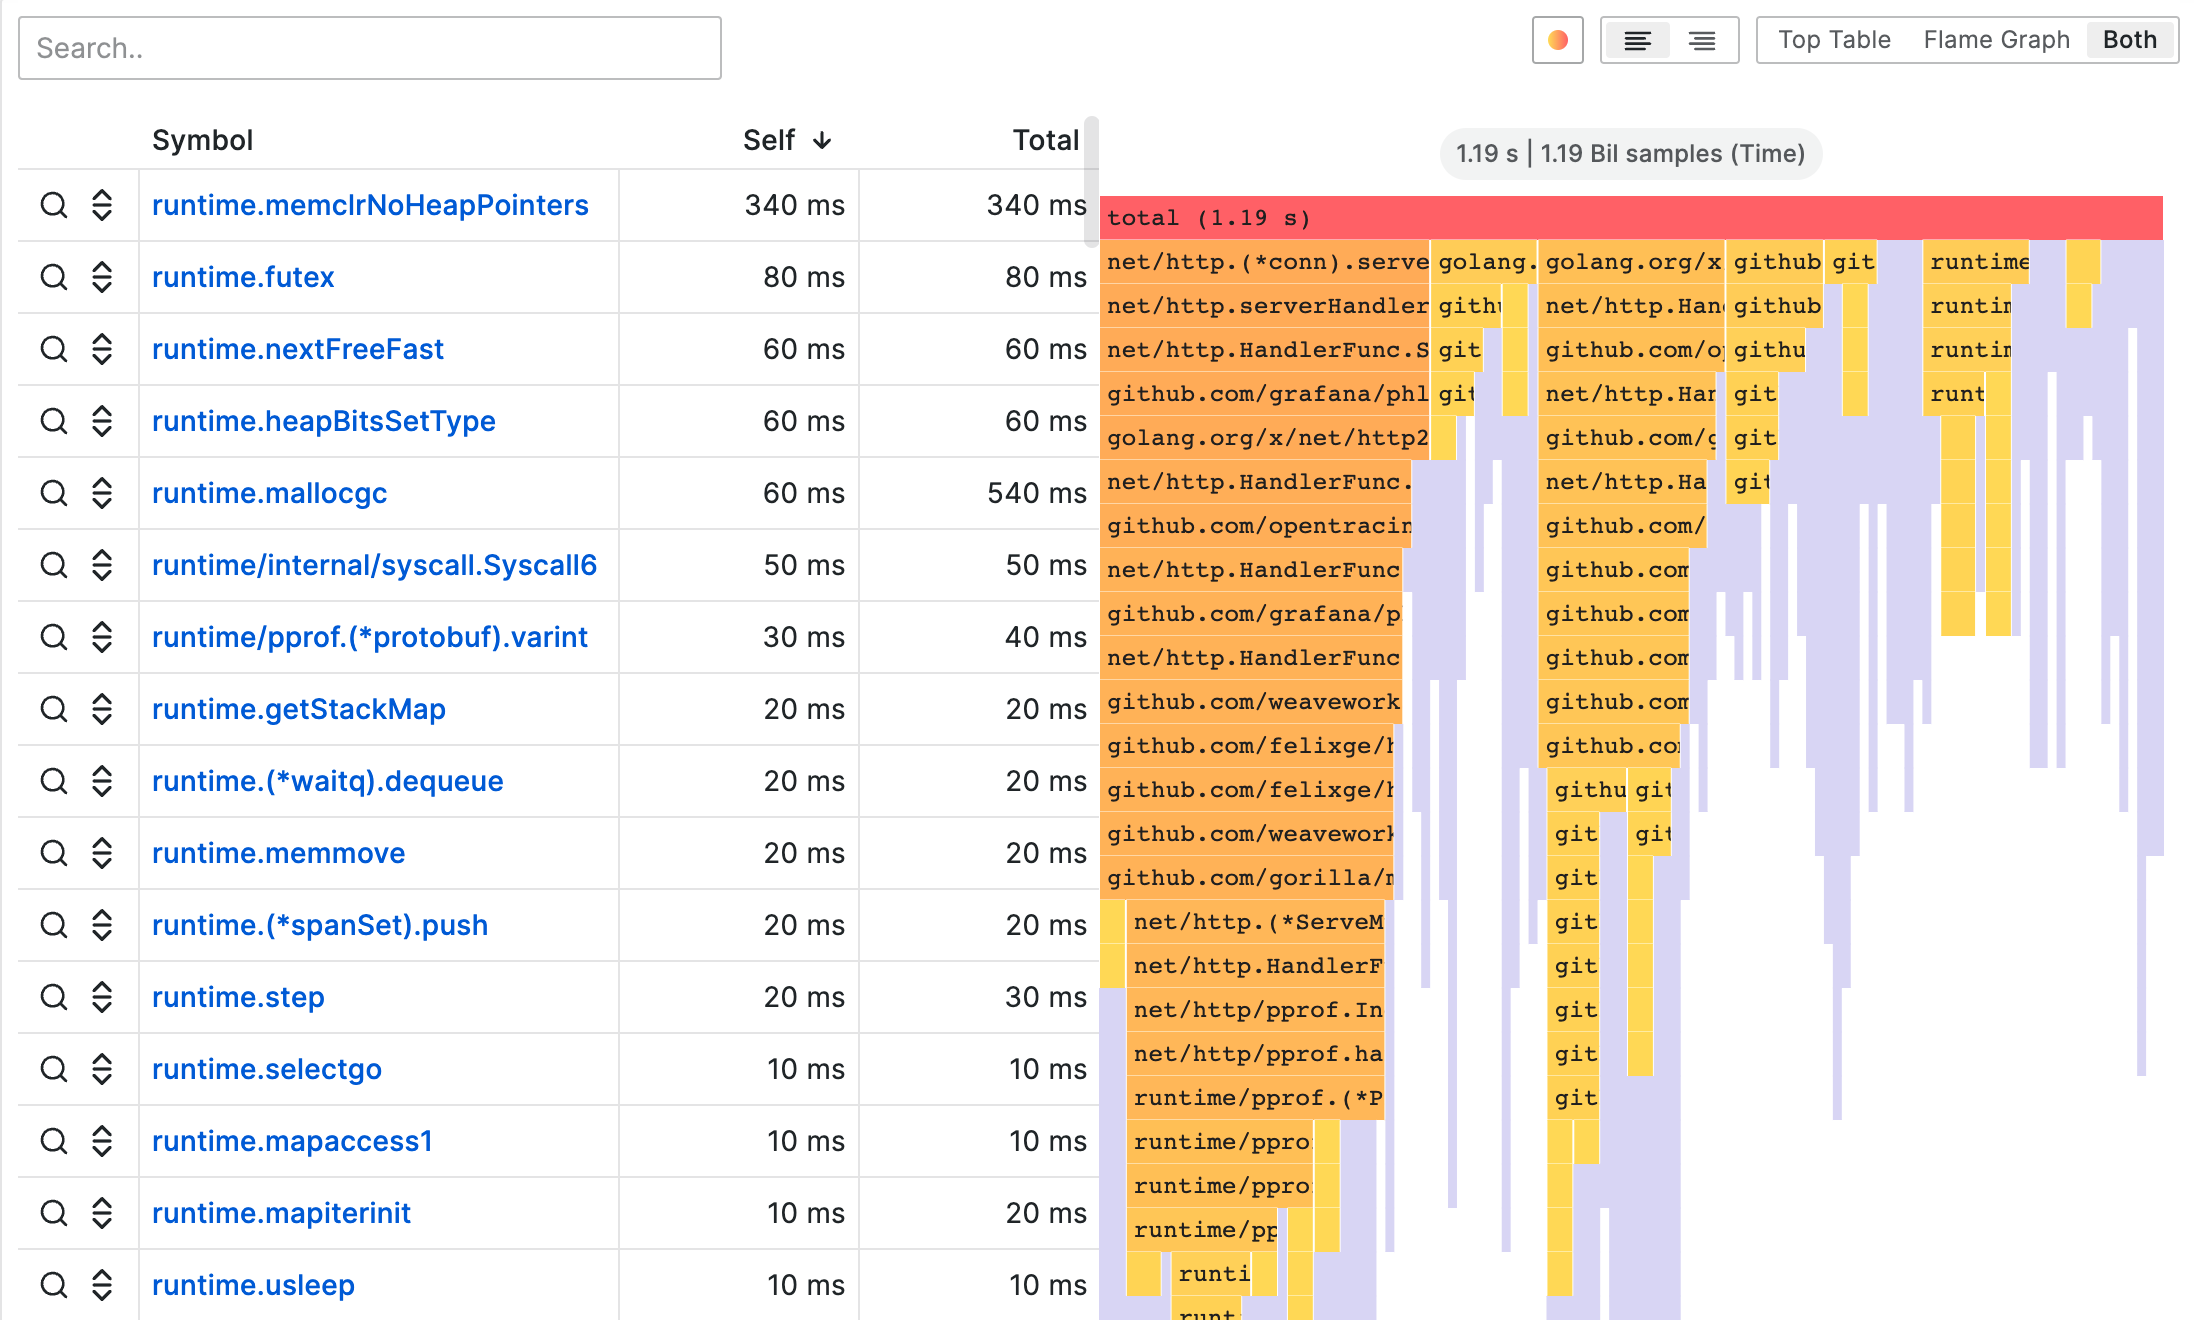
For more details on interpreting flame graphs, see the official documentation.
Deploying Pyroscope
To deploy Pyroscope, clone the ChainSafe/infrastructure-general repository and execute the following command:
$ ansible-playbook ./playbooks/deploy_pyroscope.yml -l <your_hostname_or_group>
This command typically targets the metrics group, which includes all monitoring tools. No further configuration is required for our setup, but you may specify a configuration file using a flag. For a list of CLI flags, access the Pyroscope container and run pyroscope -help. More information is available here
Deploying & Configuring Grafana Agent
Deployment
For our specific requirements, we'll deploy Grafana Agent in Flow mode. Clone the ChainSafe/infrastructure-general repository and run:
$ ansible-playbook ./playbooks/deploy_grafana_agent.yml -l <your_hostname_or_group>
This should be done on all hosts you wish to monitor.
Configuration
The configuration file, located at ./roles/grafana_agent/templates, includes settings for logging, metric scraping, and data pushing to the Pyroscope server. Below is an example configuration:
# Logging configuration
logging {
  level  = "info"
  format = "logfmt"
}

# Write job for sending data over to the Pyroscope server
pyroscope.write "write_job_example" {
        endpoint {
                url = "<http://pyroscope.example.com:4040>" # Pyroscope server url where the data is sent
        }
}

# Scrape job for scraping data from the nodes
pyroscope.scrape "scrape_job_example" {
        targets = [{"__address__" = "<http://target.example.com/6060>", "service_name" = "example_service_name"}] # target hosts to be scraped from
        forward_to = [pyroscope.write.write_job_example.receiver] # forwarding data to the write job

        profiling_config {
                profile.process_cpu {
                        enabled = true
                }

                profile.godeltaprof_memory {
                        enabled = false
                }

                profile.memory {
                        enabled = true
                }

                profile.godeltaprof_mutex {
                        enabled = false
                }

                profile.mutex {
                        enabled = true
                }

                profile.godeltaprof_block {
                        enabled = false
                }

                profile.block {
                        enabled = true
                }

                profile.goroutine {
                        enabled = true
                }
        }
}
For additional information, refer to the documentation.