Staging Environment Overview
Background
This Forest staging environment is set up to monitor and validate the performance of Forest nodes on both the Mainnet and Calibnet networks. The goal is to ensure stability, identify any memory leaks, and verify that resource usage aligns with expectations.
Monitoring and alerting systems are set up to notify the team via Slack about critical issues. This includes alerts for node crashes, high memory or disk usage, and synchronization problems.
Additionally, secure SSH access is provided to the Forest team for troubleshooting the node servers.
Architecture Diagram
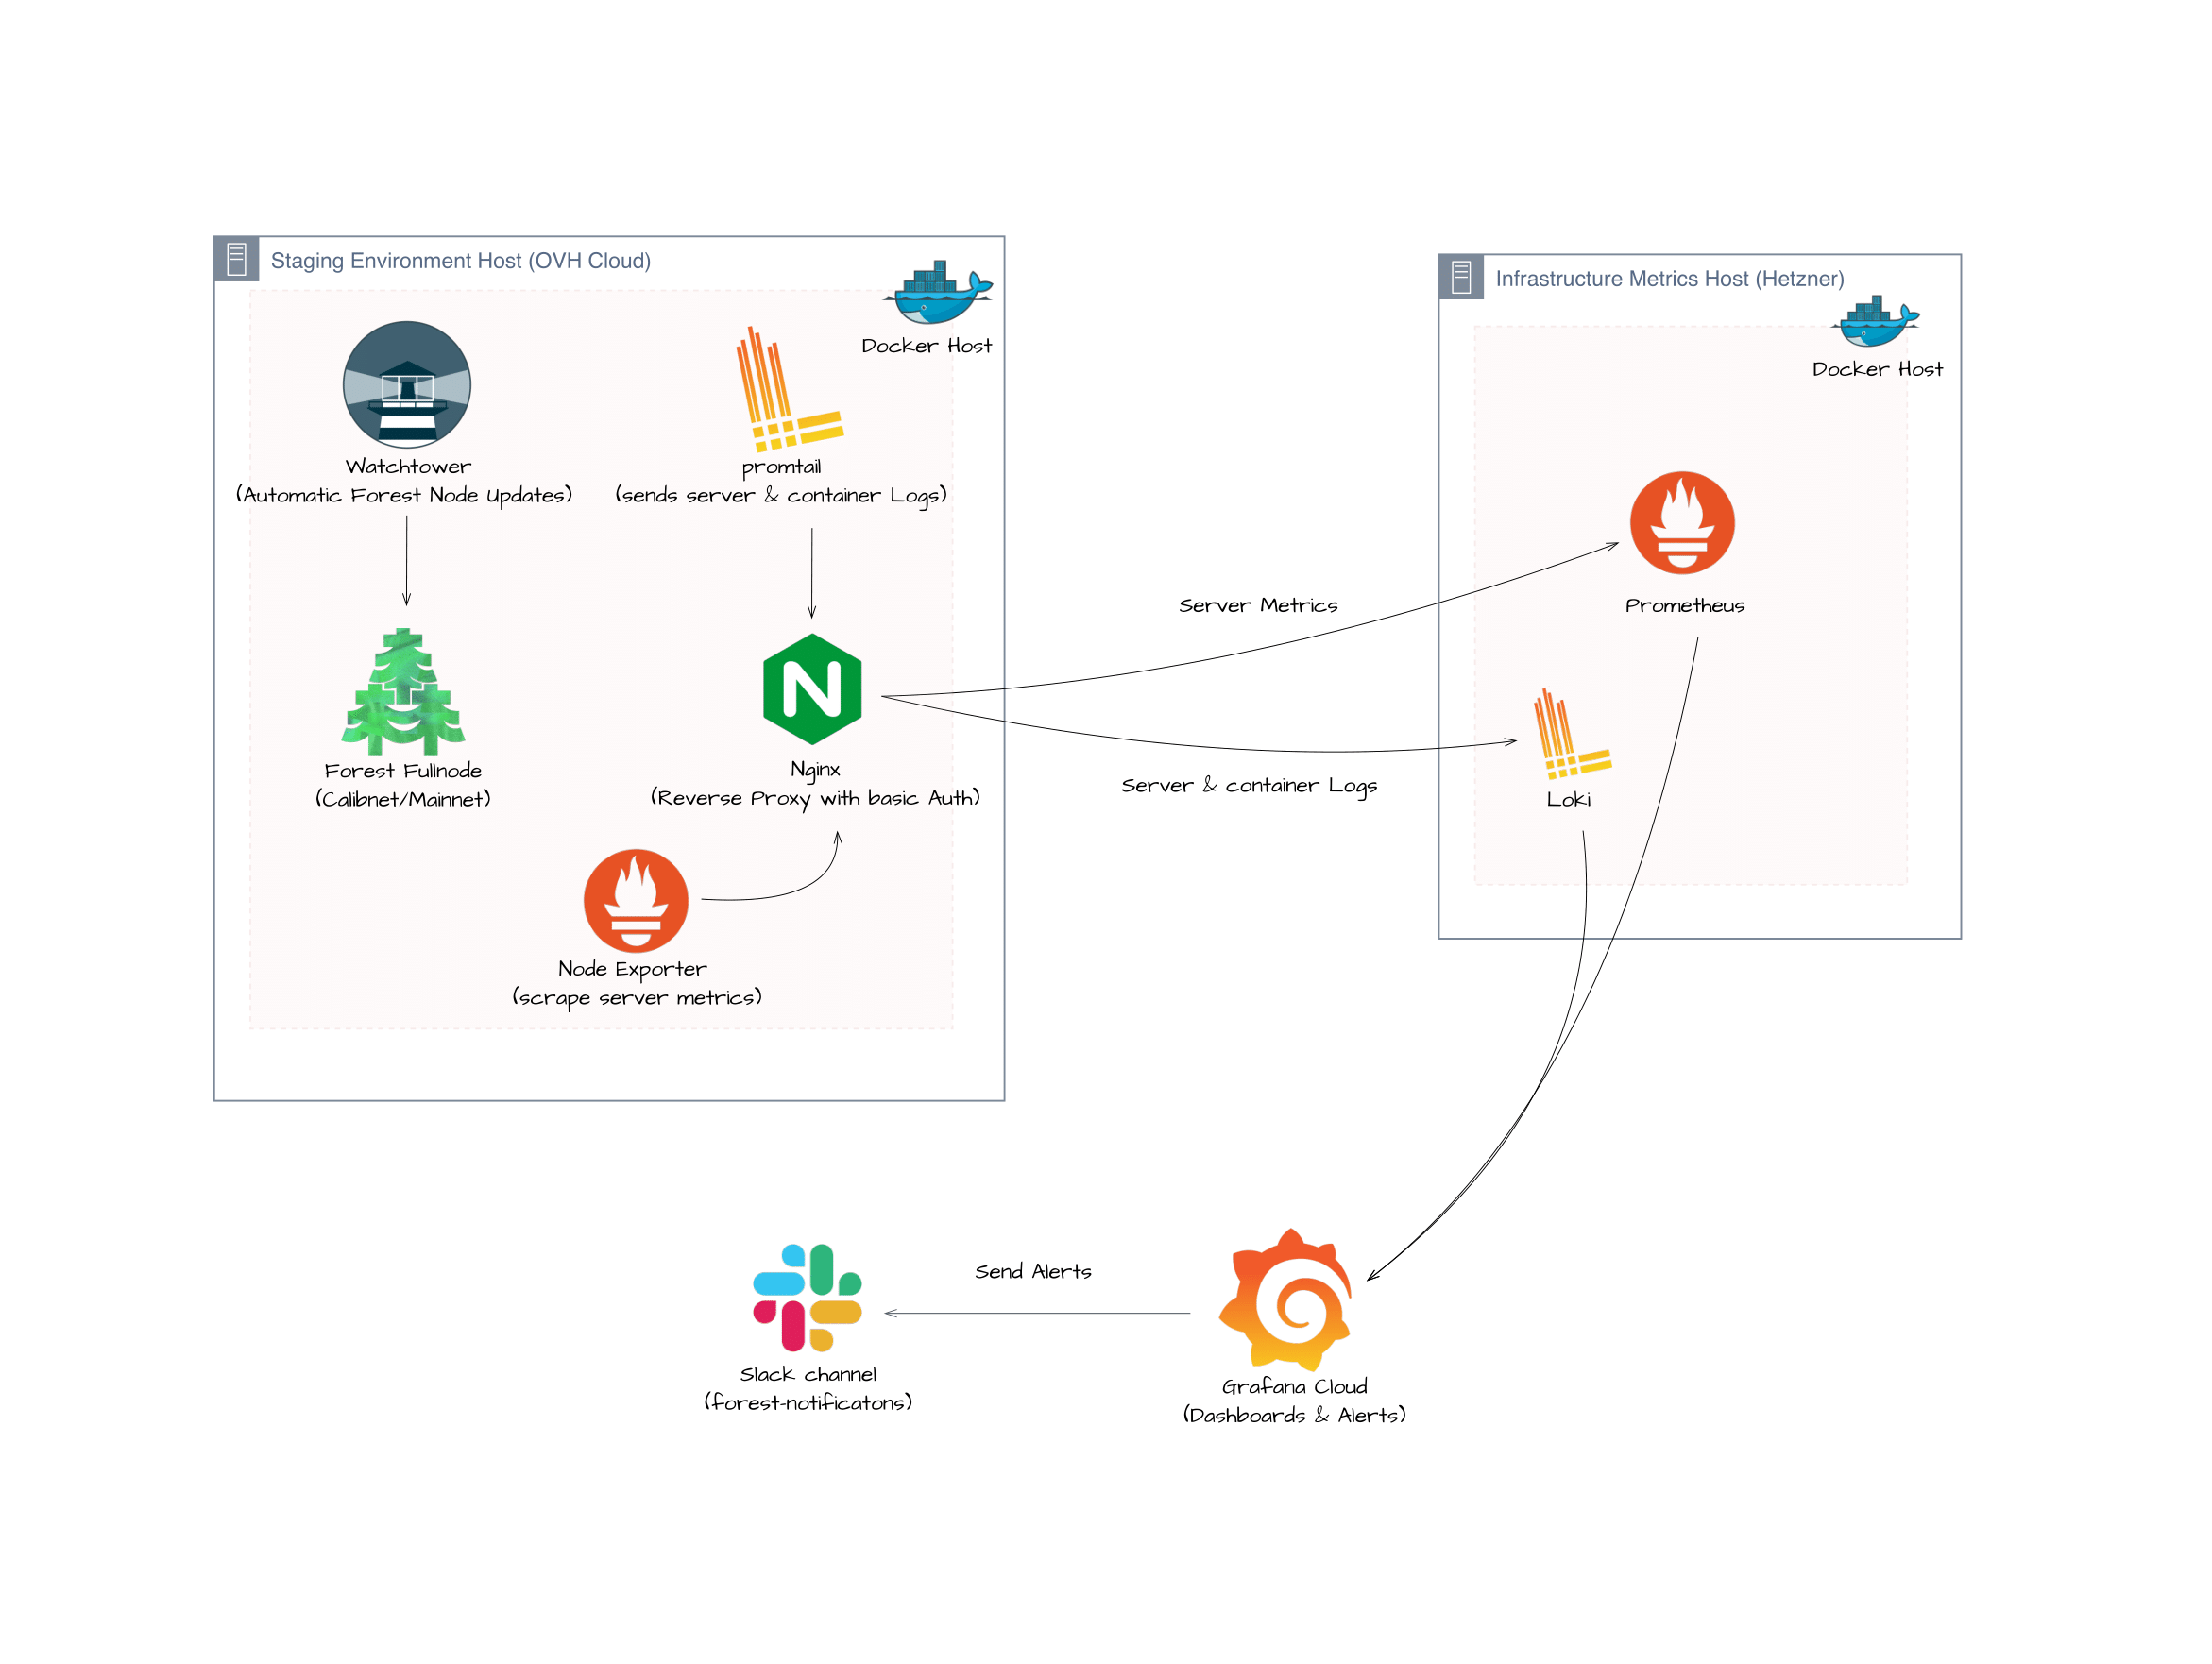
Environment Overview:
- Calibnet: Forest full node (Docker) with 4 GiB of allocated memory.
- Mainnet: Forest Full node (Docker) with 16 GiB of allocated memory.
- Watchtower: Docker service that automatically updates Forest nodes by scanning for new images on a daily basis.
- Promtail: Collects and ships logs to Loki for aggregation and analysis.
- Node Exporter: Monitors hardware and OS metrics, exposing them to Prometheus.
- Nginx: Acts as a reverse proxy for the services.
You can find the Ansible code for executing the services in the Forest environment here.
Server Hardware Specifications
Calibnet:
- RAM: 32 GB ECC 2666 MHz
- Storage: 2×500 GB SSD NVMe with Soft RAID
Mainnet:
- RAM: 32 GB 5200 MHz
- Storage: 2×960 GB SSD NVMe
Monitoring and Alerting
Note: The following monitoring and alerting tools, including Prometheus, Loki, and Grafana, are set up and managed by the infrastructure team.
Prometheus
- Setup: Hosted on the infrastructure metrics server, Prometheus aggregates metrics from Node Exporter installed on Forest nodes. It continuously scrapes and stores performance data, such as CPU usage, memory utilization, and disk I/O.
Loki
- Setup: Loki, hosted on the infrastructure metrics server, collects and stores logs from Promtail running on Forest nodes. It is used to aggregate and query logs, providing insight into node operations and troubleshooting.
Grafana
- Setup: Grafana, also hosted on the infrastructure metrics server, uses Prometheus as its data source to visualize metrics collected from Forest nodes.
- Dashboards: Visualize key metrics such as resource usage, node health, and synchronization status of Forest nodes.
- Alerts: Configured to trigger notifications based on predefined thresholds. Alerts are routed to the Forest team's Slack channel
forest-notificationsfor timely updates.
Access and Troubleshooting
Team members can log in to Grafana Cloud using their GitHub account.
Grafana Dashboard: Access the metrics and logs dashboard using the following links:
- Calibnet: Dashboard, Explore Logs
- Mainnet: Dashboard, Explore Logs
Grafana Alert Rules: To modify alert rules, team members can access the alert rule configuration via the Grafana Alert Rules link. You can review and adjust thresholds and conditions as needed.
Alert Descriptions:
These alerts can be modified in Grafana via the links provided.
-
ForestNodeCrash: Triggers on unexpected node crashes, requiring immediate attention.
Alert link: ForestNodeCrash
-
ForestMainnetMemoryExceeded & ForestCalibnetMemoryExceeded: Alerts when node memory usage exceeds set limits, 4 GiB for Calibnet and 16 GiB for Mainnet.
Alert Links:
- Calibnet: ForestCalibnetMemoryExceeded
- Mainnet: ForestMainnetMemoryExceeded
-
ForestNodeDiskSpaceLow: Warns of low disk space on a Forest node, risking performance.
Alert link: ForestNodeDiskSpaceLow
-
ForestNodeSyncOutOfRange: Detects when a Forest node is out of sync, indicating network or data issues.
Alert link: ForestNodeSyncOutOfRange
Public Key Authentication: SSH access to the server is configured using GitHub public keys. Ensure your GitHub public key is added to the server’s authorized keys to gain access.
How to setup SSH Agent
- Start the SSH Agent
eval 'ssh-agent' - Add Your SSH Key to the Agent
ssh-add ~/.ssh/id_rsa
SSH Command:
ssh devops@server-ip
find the server IP in the forest-team-execution hosts.ini