Metrics
Introduction
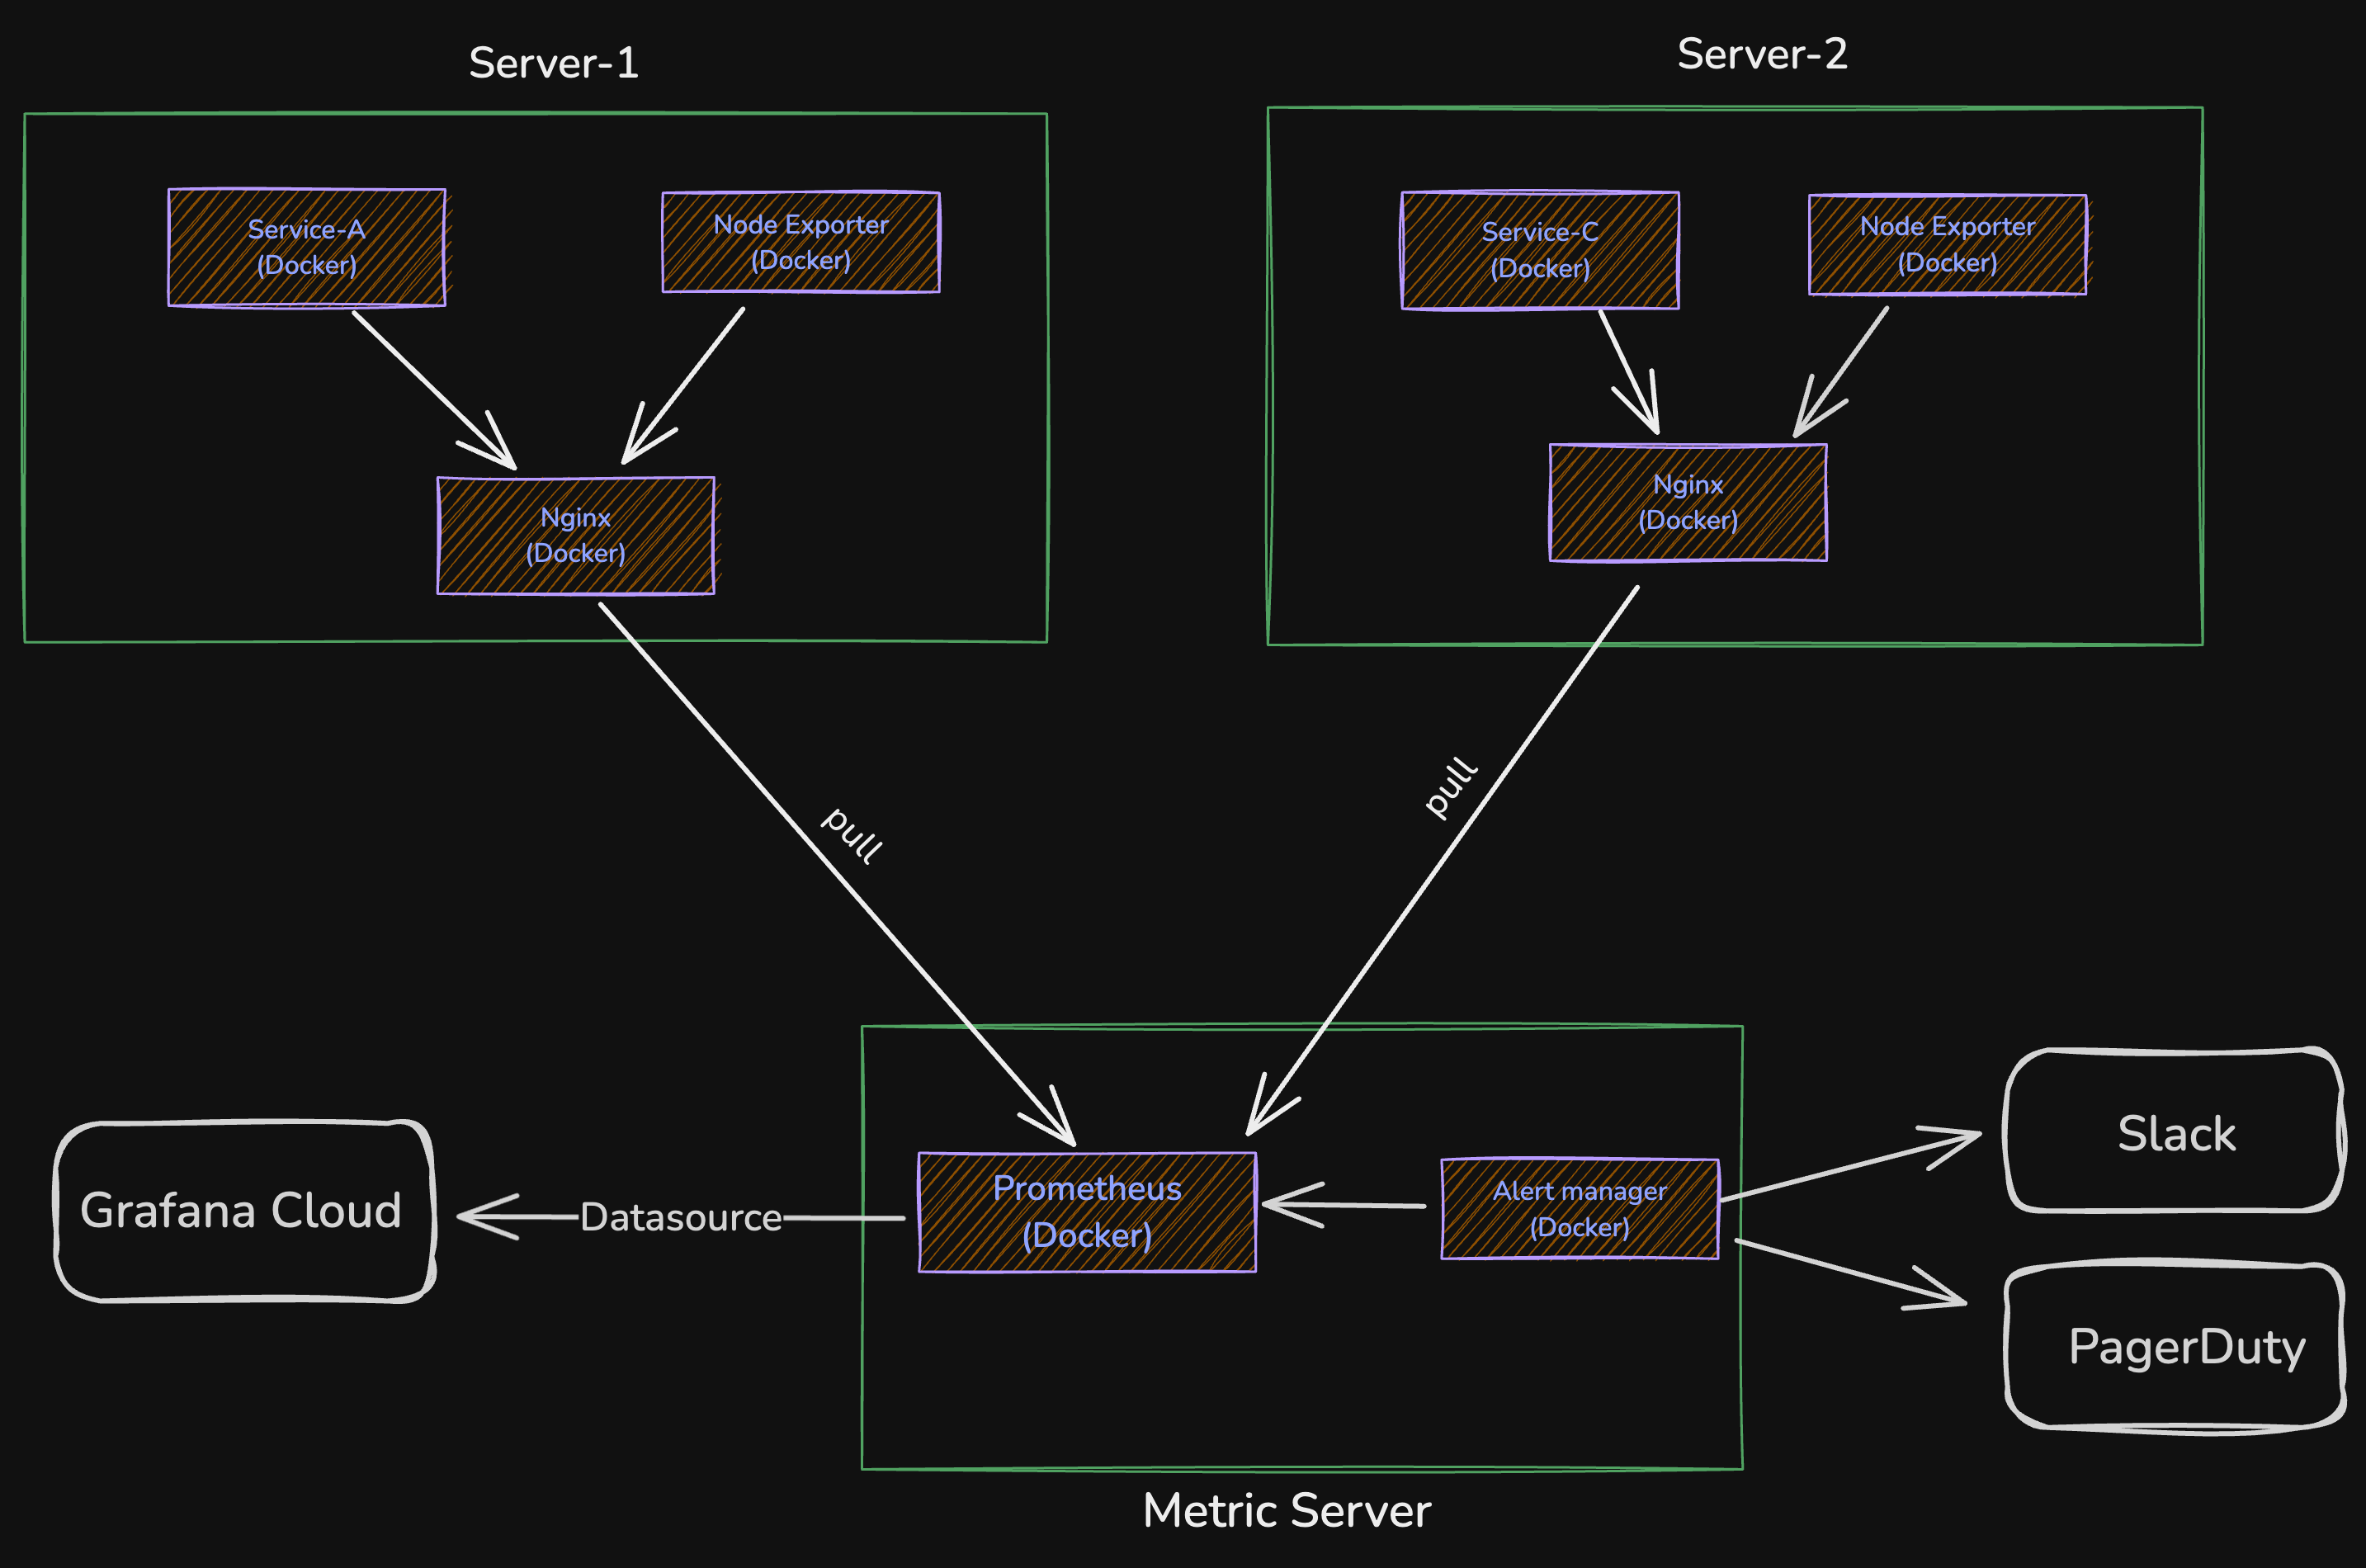
Metrics Infrastructure
Prometheus is an open-source systems monitoring and alerting toolkit used for metrics collection and storage.
By default, Prometheus pulls metrics as opposed to recieving pushed metrics from agents.
How to send Logs to infra-prometheus Datasource
The infra-prometheus Datasource is the self-hosted Prometheus server managed by the infrastructure team. infra-prometheus has a retention period of 30days.
To collect metrics from a Prometheus metrics endpoint, a target.yml file for that server has to be added to the infra-prometheus targets directory.
The Prometheus ansible-role provides an update_targets.yml ansible task required to add a new target.
Create an Ansible playbook:
Create a ./playbooks/run_update-target.yml Ansible playbook.
- hosts: metrics
  gather_facts: false
  name: Update Prometheus Targets
  become: true
  tasks:
    - name: Include tasks from chainsafe.general.prometheus role
      include_role:
        name: chainsafe.general.prometheus
        tasks_from: update_targets.yml
Create targets.yml file:
Create a ./playbooks/templates/<project>_targets.yml file. The ./playbooks/templates/<project>_targets.yml file holds the labels and target endpoint of your host.
- labels:
    scrape_location: node_exporter
    job: node_exporter
    instance: "server-1"
    project_name: "ethereum"
    targets:
    - "34.56.077.55:8083"
Here is a more complex ansible example with conditionals.
Set Ansible variables:
Set update_targets.yml variables:
###### Prometheus target vars #####
prometheus_target_dir: "{{home_dir}}/prometheus/targets"
target_template: "<project>_targets.yml"
#Ansible group to collect metrics from
target_group: "prometheus_target_group"
Dry-run Ansible playbook:
Dry-run the run_update-target.yml playbook:
$ ansible-playbook ./playbooks/run_update-target.yml -l 'infra-metrics-server' --diff --check
Run Ansible playbook:
Run the run_update-target.yml playbook after confirming the intended changes:
$ ansible-playbook ./playbooks/run_update-target.yml -l 'infra-metrics-server'
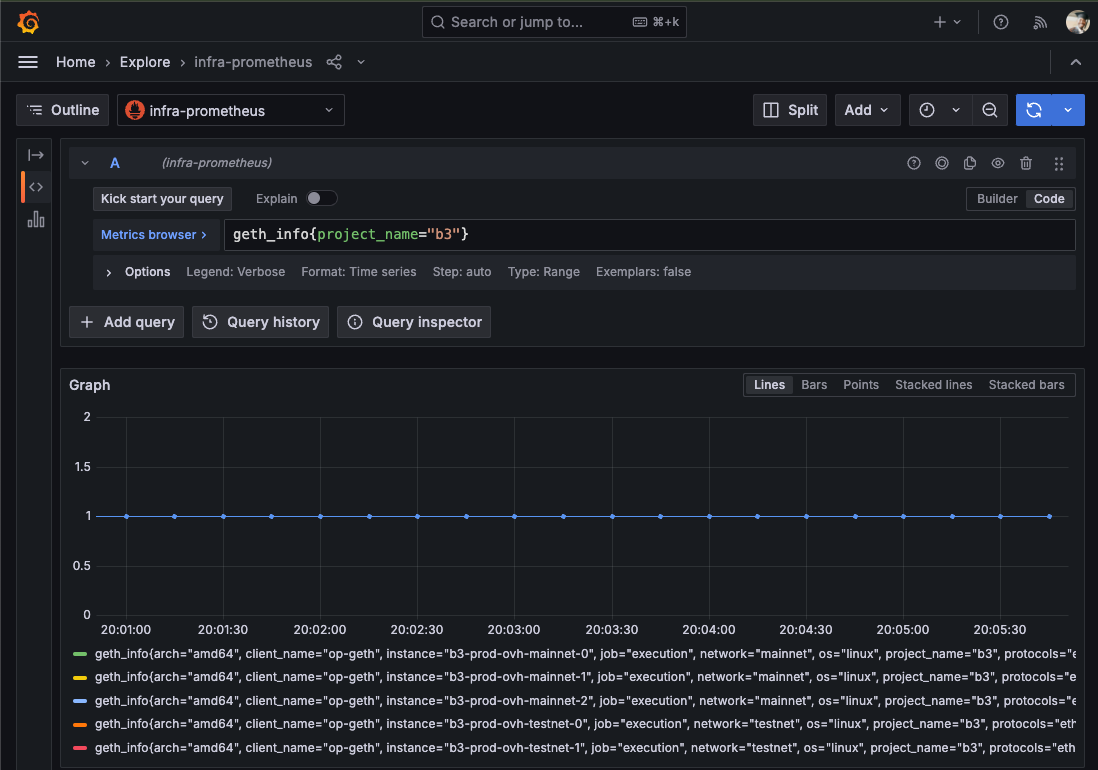
View Metrics:
If setup properly, metrics will be visible on Grafana cloud.