Lodestar Observability
The metric server runs:
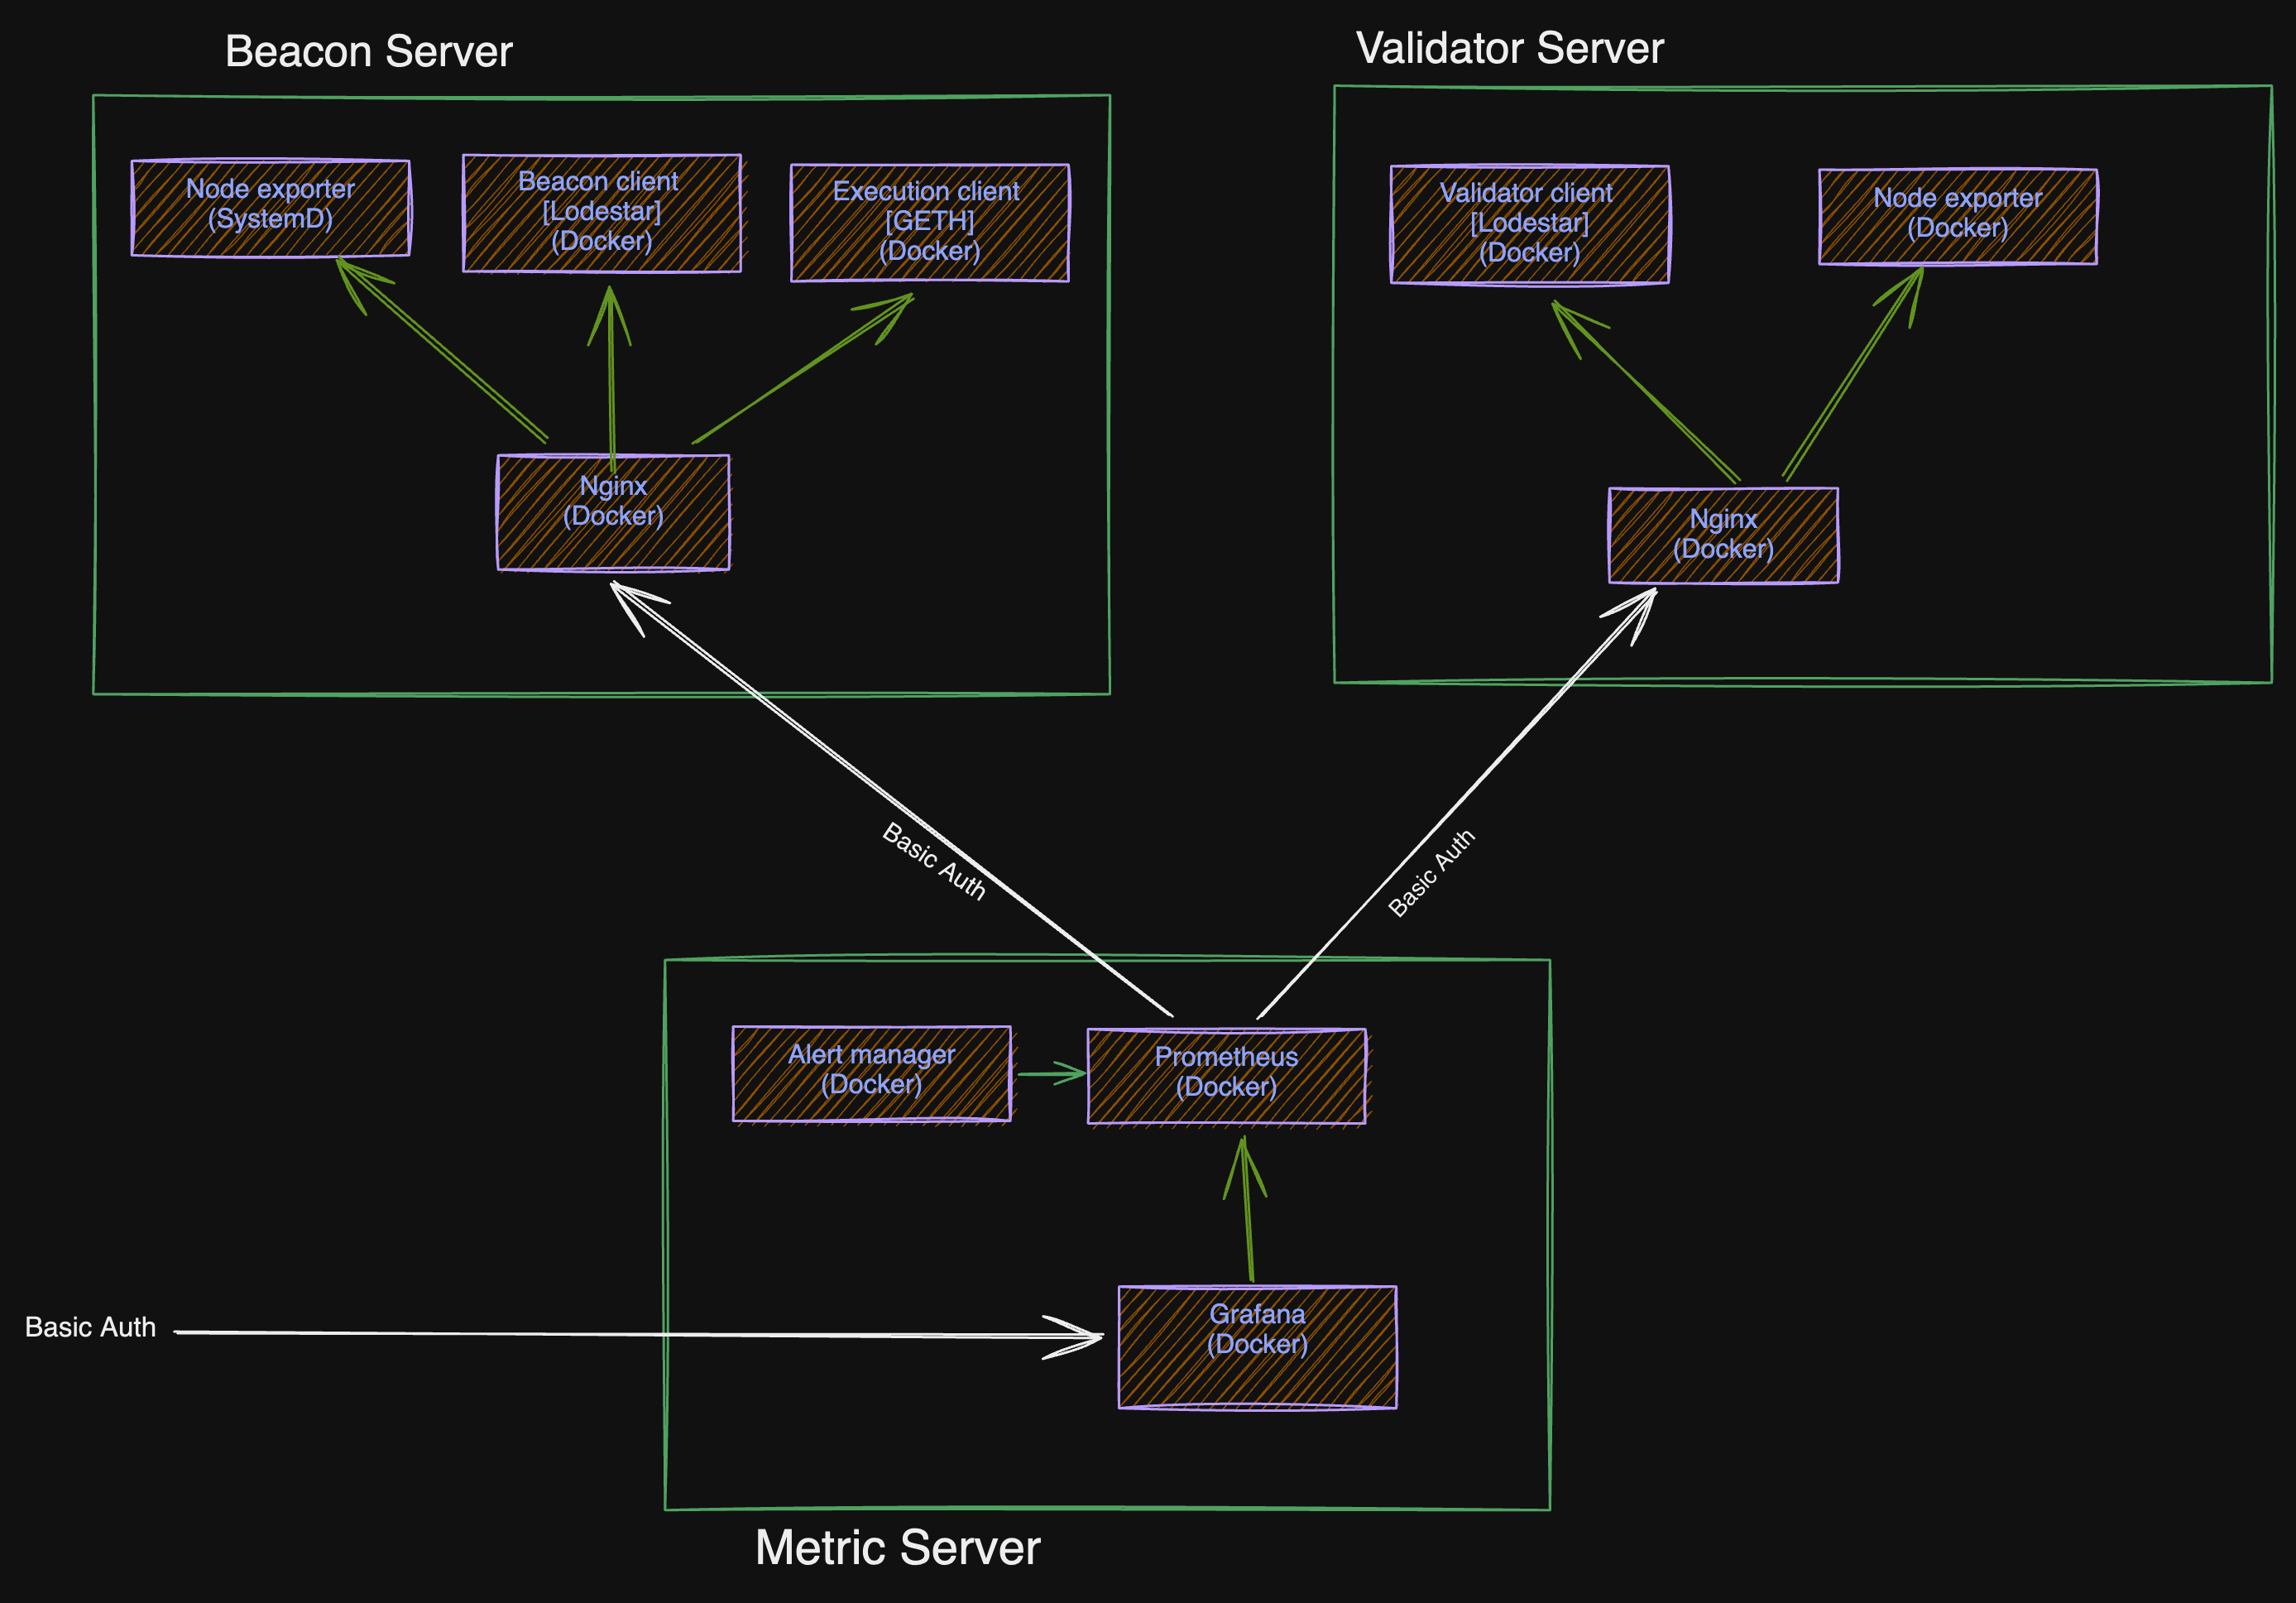
- Grafana container: Visualising Prometheus metrics.
- Alertmanager container: Managing Alerting rules.
- Prometheus container: PULLS metrics from beacon and validator servers.
- Nginx container: Reverse proxy to Grafana, Prometheus and Alertmanager UI. TLS termination happens on a Scaleway Load balancer.
The metric server hosts monitoring and alerting services. New Prometheus targets are added to the prometheus/targets directory using the update_targets_only.yml ansible task.
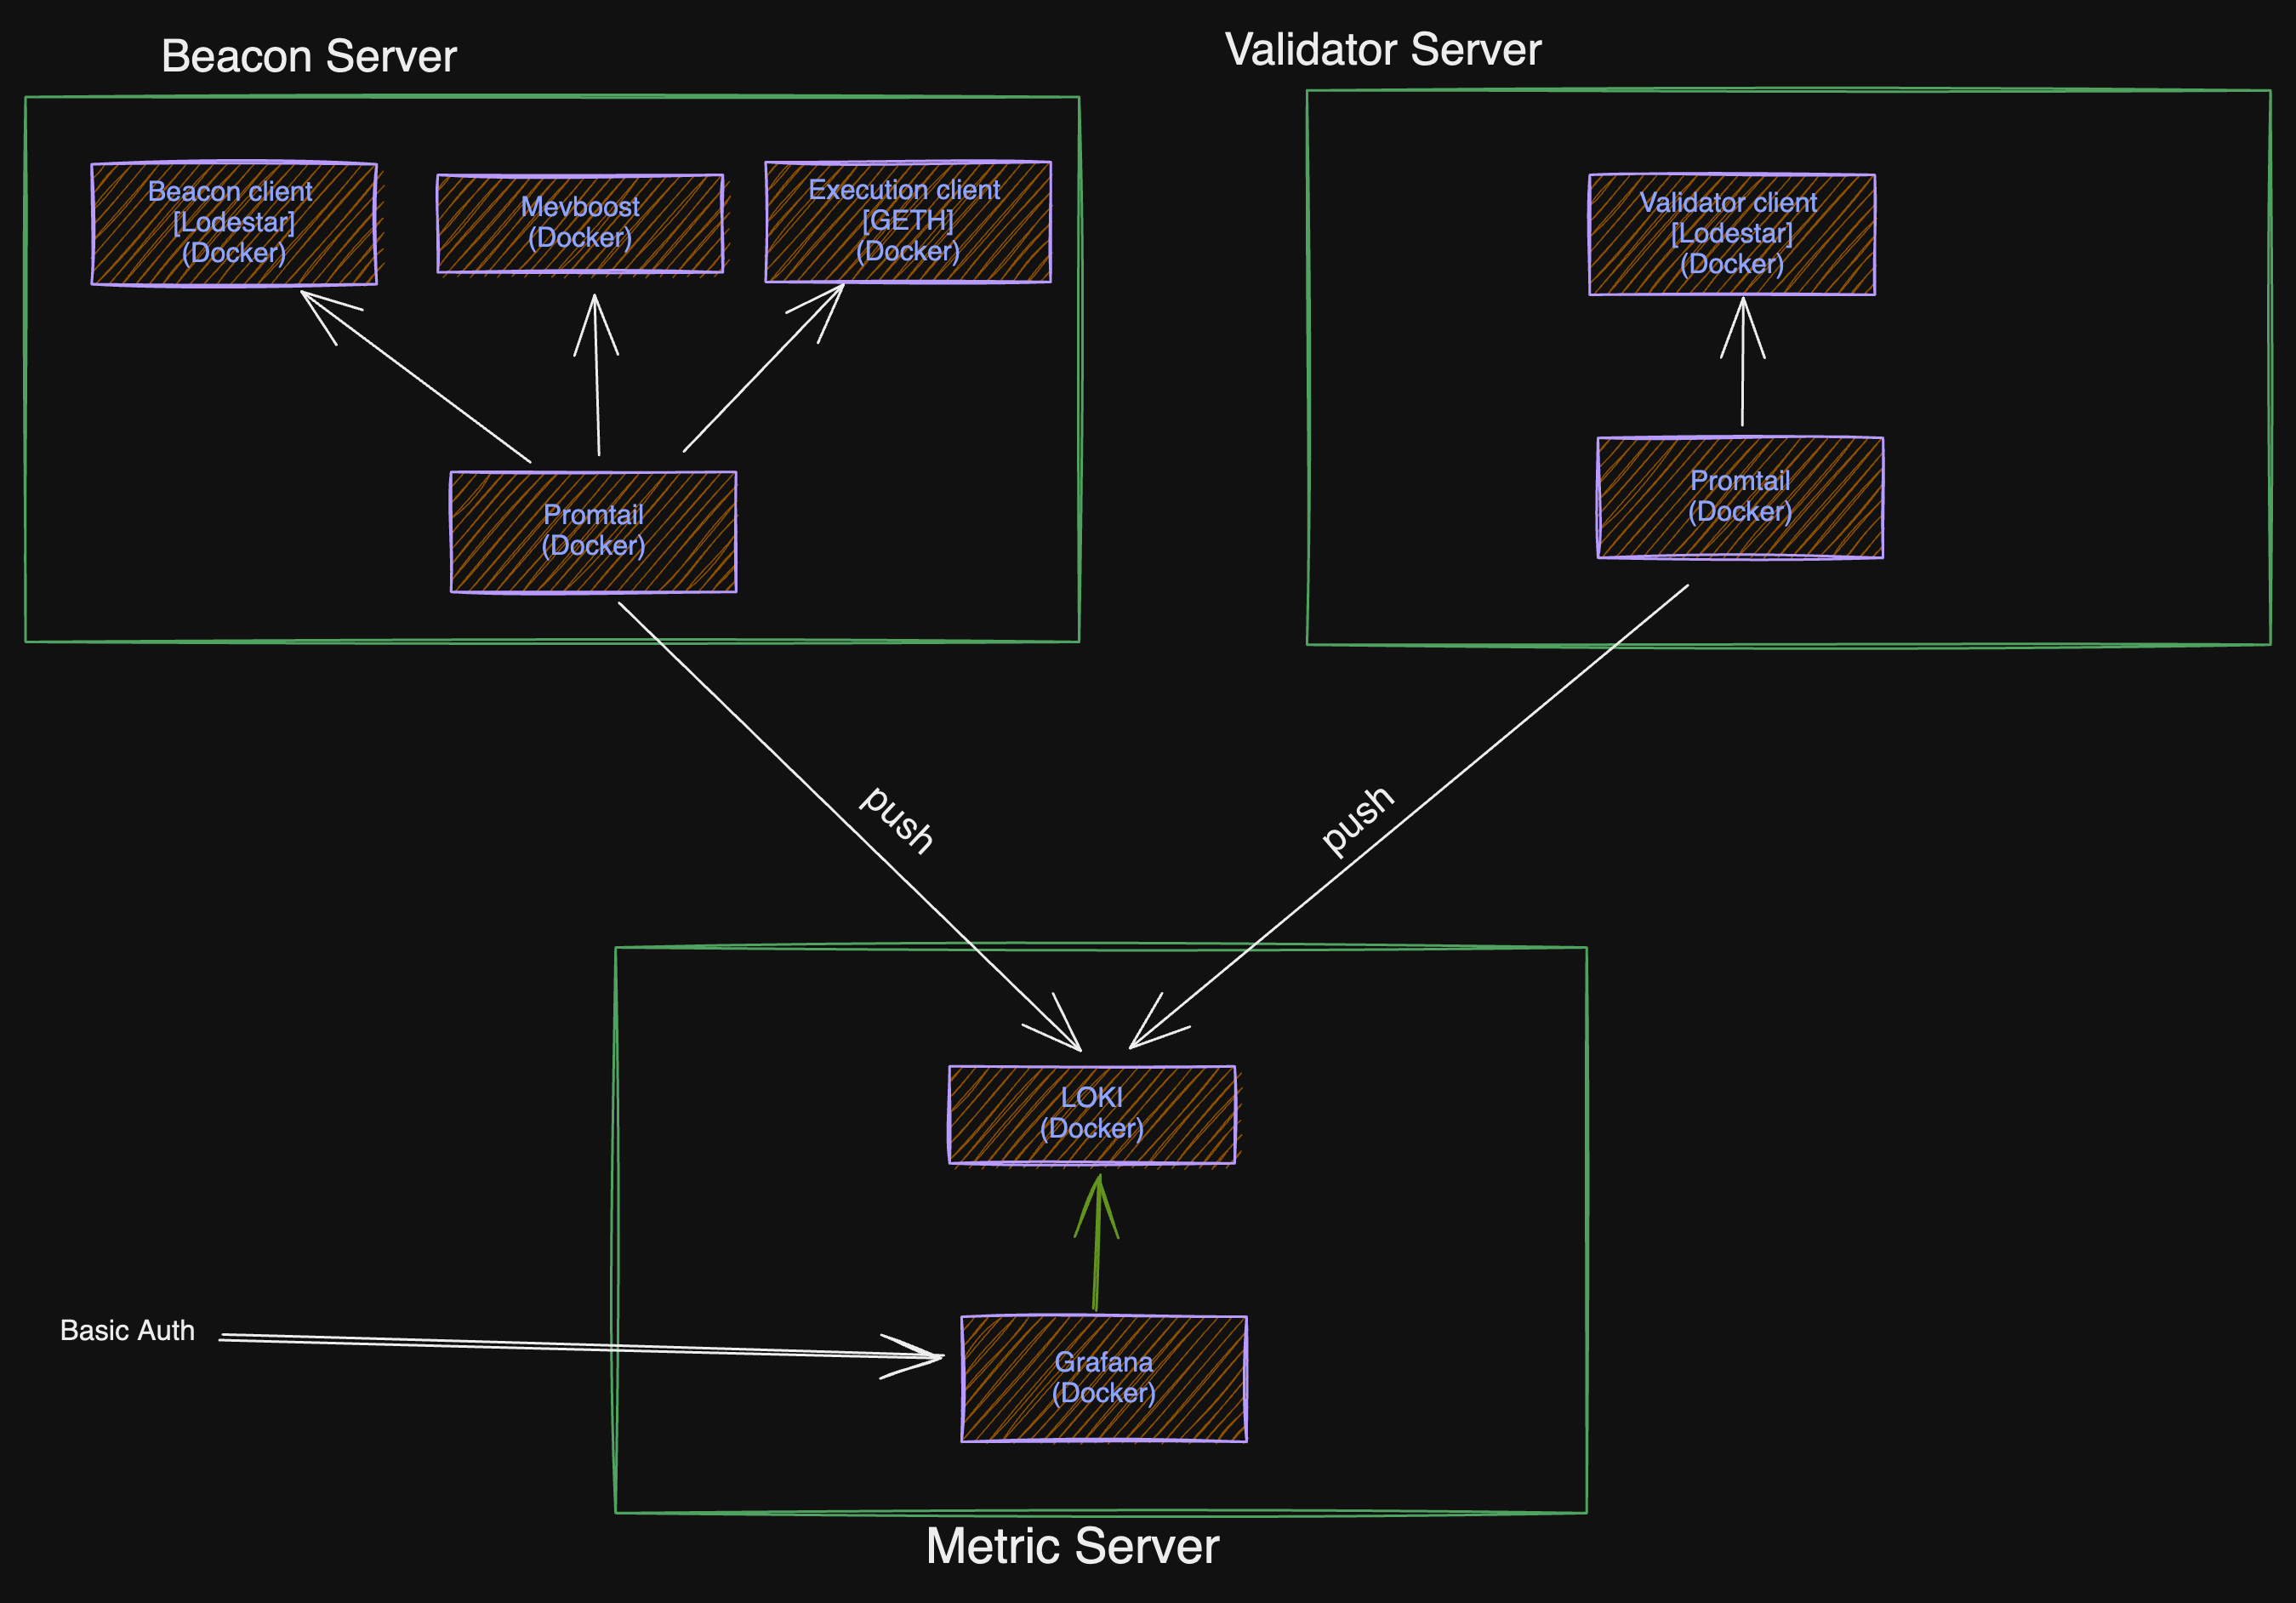
The metrics server is also used to collect logs. Promtail runs on all hosts, it is used to forward logs to the Loki container running on the metric server.